

ที่มาภาพ: https://www.nytimes.com/interactive/2020/03/23/opinion/coronavirus-economy-recession.html
ล่าสุดทางบริษัท Descartes Labs ซึ่งเป็นบริษัทที่เชี่ยวชาญด้านการวิเคราะห์ข้อมูลเชิงพื้นที่ (Spatial data) ได้นำเสนอข้อมูลที่แสดงให้เห็นถึงผลกระทบของการแพร่ระบาดของเชื้อไวรัสโคโรนาในอเมริกาว่าประชาชนลดการเดินทางลงอย่างเห็นได้ชัดหลังจากที่มีจำนวนผู้ติดเชื้อเพิ่มสูงขึ้น โดยผู้ที่สนใจสามารถเข้าถึงข้อมูลชุดนี้ได้ฟรีจาก https://github.com/descarteslabs/DL-COVID-19
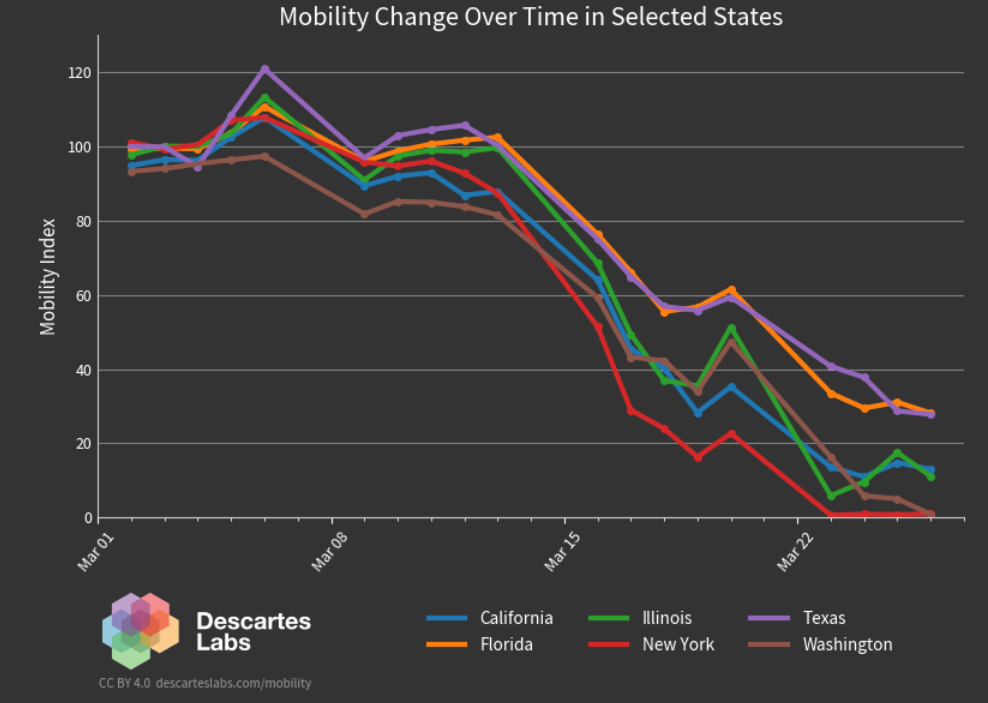
ที่มาภาพ: https://www.descarteslabs.com/mobility/
ประเทศสหรัฐฯเป็นหนึ่งในประเทศที่มีผู้ติดเชื้อCOVID-2019อยู่เป็นอันดับต้นๆของโลก ทางรัฐบาลจึงมีมาตรการลดการแพร่ระบาดของเชื้อไวรัสโคโรนาโดยให้ประชาชนทำ Social Distancing และ work-from-home อย่างไรก็ตาม การตอบสนองนโยบายหรือประสิทธิภาพของนโยบายอาจจะขึ้นอยู่กับพฤติกรรมของประชาชนในแต่ละเขต เราจะสามารถที่จะใช้เทคโนโลยี Big Data มาตรวจสอบผลกระทบของการใช้มาตรการ Social Distancing และ work-from-home ได้อย่างไร

ภาพที่ 3: เปรียบเทียบการเดินทางของประชาชนก่อน – หลังมีมาตรการ Social Distancing และ work-from-home
ที่มาภาพ: https://www.nytimes.com/interactive/2020/03/23/opinion/coronavirus-economy-recession.html
ข้อมูลเชิงตำแหน่งจากโทรศัพท์มือถือและการเปรียบเทียบค่าเฉลี่ยของระยะการเดินทาง
เราสามารถนำข้อมูลเชิงตำแหน่งจากโทรศัพท์มือถือมาคำนวณหาระยะการเดินทางของแต่ละบุคคลในแต่วัน จากนั้นเรานำข้อมูลระดับบุคคลมาสร้างเป็นข้อมูลระดับรัฐเพื่อจะใช้ในการเปรียบเทียบว่าในแต่ละวันนั้น ระยะการเดินทางเฉลี่ยของประชาชนในแต่ละรัฐนั้นได้เพิ่มขึ้นหรือลดน้อยลงจากค่าปกติมากน้อยเท่าใด หากประชาชนในรัฐใดมีระยะการเดินทางเฉลี่ยของแต่ละวันลดลง ก็น่าจะแสดงให้เห็นว่าประชาชนในรัฐนั้นโดยเฉลี่ยแล้วมีการทำตามนโยบาย Social Distancing และ work-from-home อย่างชัดเจน แต่หากระยะการเดินทางเฉลี่ยของแต่ละวันไม่มีการลดลงเลยหรือเปลี่ยนแปลงน้อยมาก ก็ย่อมแสดงว่าประชาชนในรัฐนั้นไม่ปฎิบัติตามคำแนะนำของแพทย์และรัฐบาล
สำหรับค่าปกติที่จะนำมาใช้ในการเปรียบเทียบนั้น สามารถใช้ moving-average มาคำนวณค่าปกติตัวนี้ได้ เนื่องจากข้อมูลเชิงตำแหน่งที่นำมาใช้เป็นข้อมูลในลักษณะของข้อมูลอนุกรมเวลา (time series data) นั่นคือเป็นข้อมูลที่แสดงค่าตามกาลเวลา ซึ่งในกราฟเส้นตามภาพที่ 3 นั้น เจ้าของกราฟได้ใช้ 3-day moving average มาคำนวณหาค่าปกติ
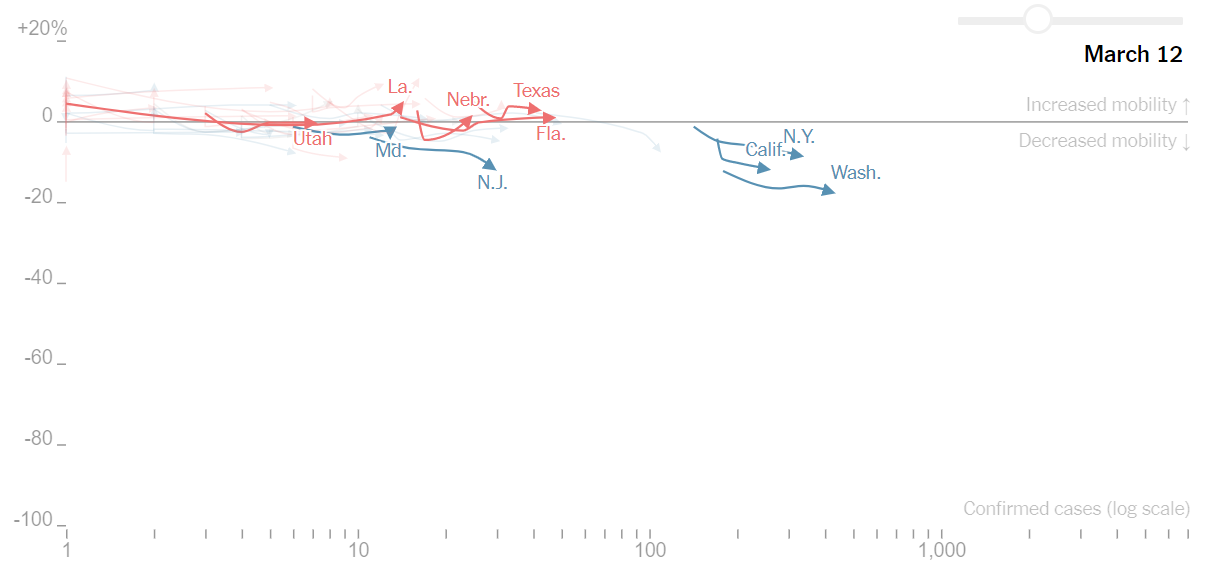
การใช้สีเพื่อบ่งบอกความนิยมพรรคการเมืองในแต่ละรัฐ
ประเทศสหรัฐฯเป็นประเทศที่ใช้ระบบการเมืองแบบสองพรรค คือ พรรคริพับลิกัน (Republican Party) กับพรรคเดโมแครต (Democrat Party) โดยพรรคริพับลิกันจะใช้สีแดงเป็นสีประจำพรรค ส่วนพรรคเดโมแครตจะใช้สีน้ำเงิน นักวิจัยที่สร้างvisualizationชุดนี้ได้ใช้สีประจำพรรคการเมือง เพื่อสื่อให้เห็นว่าความนิยมในพรรคการเมืองของประชาชนส่วนใหญ่ในรัฐนั้นจะมีผลกระทบต่อการตอบสนองของมาตรการที่ออกโดยรัฐบาลหรือไม่ การกำหนดค่าของสีนั้นใช่ข้อมูลจาก Partisan Voter Index ของการเลือกตั้งในปี 2017 เพื่อบ่งบอกว่ารัฐไหนควรแสดงเป็นสีใดบนกราฟเส้น จากกราฟเส้นในรูปภาพที่ 1 เราสามารถเห็นได้อย่างชัดเจนว่า ถึงแม้ทุกรัฐในประเทศสหรัฐฯจะเกรงกลัวต่อการติดเชื้อไวรัสโคโรนา บางรัฐมีพฤติกรรมการเดินทางที่ลดลงอย่างรวดเร็วและเห็นได้ชัดเจน ในขณะที่บางรัฐมีพฤติกรรมการเดินทางที่ลดลง แต่ก็ไม่ได้ลดลงอย่างรวดเร็ว
ดังนั้น การที่ผู้สร้างกราฟเส้นชุดนี้ได้ใช้สีประจำพรรคการเมืองมาแยกระหว่างรัฐที่นิยมพรรคริพับลิกันกับรัฐที่นิยมพรรคเดโมแครต จึงทำให้เราสามารถมองเห็นอย่างทันทีและชัดเจนว่า ความนิยมของพรรคการเมืองน่าจะมีผลกับความเร็วหรือความเข้มข้นในการตอบสนองมาตรการSocial Distancing และ work-from-home ด้วย รัฐที่นิยมพรรคเดโมแครต (เส้นสีน้ำเงิน) นั้นส่วนใหญ่จะลดการเดินทางลงกันอย่างเห็นได้ชัดเจนและรุนแรงกว่ารัฐที่นิยมพรรคริพับลิกัน (เส้นสีแดง) แต่สุดท้ายแล้ว สิ่งที่เราเห็นได้อย่างแน่ชัดคือไม่ว่าจะเป็นรัฐใดก็ตาม จำนวนผู้ติดเชื้อไวรัสโคโรนาที่เพิ่มสูงขึ้นส่งผลให้ประชาชนทั่วทุกรัฐในประเทศสหรัฐฯลดการเดินทางลงอย่างเห็นได้ชัด
ดังนั้น ข้อมูลเชิงตำแหน่งจากโทรศัพท์มือถือน่าจะสามารถที่จะนำมาใช้ตรวจสอบผลกระทบของการออกมาตรการ Social Distancing และ work-from-home ในแต่ละประเทศได้อย่างมีประสิทธิผล
ที่มาเนื้อหา:
- https://www.nytimes.com/interactive/2020/03/23/opinion/coronavirus-economy-recession.html
- https://www.descarteslabs.com/mobility/
- https://flowingdata.com/2020/03/24/mobile-phone-data-shows-decreased-movement-nationwide/
Vice President, Data Analytics Services Division (DAS)
Big Data Institute (Public Organization), BDI